


The sunset of Universal Analytics forced a mass migration to Google Analytics 4 (GA4), but many marketers are still using the new platform as a simple counter, looking at pageviews and users without digging into the “why.” The true power of GA4 lies not in its standard reports, but in its Advanced Reporting capabilities, specifically within the Explorations tab and the newly enhanced Reports Snapshot templates.
As of 2026, GA4 reports have matured into a predictive, event-driven powerhouse. However, its flexibility is a double-edged sword: if you don’t know how to build custom reports, you are flying blind. This analytical deep dive will provide SEO specialists and marketing professionals with a framework for building advanced reports that solve real business problems, moving beyond surface-level metrics to uncover user intent and conversion bottlenecks.
Rethinking GA4: Moving from Static Dashboards to Dynamic Analysis
Understanding the GA4 Reporting Framework
Before diving into advanced reports, we must understand the GA4 structure.
Unlike Universal Analytics, GA4 is built around:
- Events
- Parameters
- User properties
- Data streams
- Explorations
Everything in GA4 reports revolves around events. Pageviews, clicks, scrolls, conversions, all are events.
GA4 vs Universal Analytics
| Feature | Universal Analytics | GA4 |
| Data Model | Session-based | Event-based |
| Bounce Rate | Default metric | Replaced by Engagement Rate |
| Cross-device tracking | Limited | Native |
| Predictive metrics | No | Yes |
| Attribution model | Last click | Data-driven |
1. The Shift in Philosophy: Why Standard Reports Aren’t Enough
In Universal Analytics, reports were static and session-based. GA4 is event-based and user-centric. Standard reports in GA4 (Life Cycle collection) are excellent for high-level monitoring, but they suffer from the same limitations as a car’s speedometer, they tell you how fast you are going, but not how to optimize the engine.
The Analytical Gap:
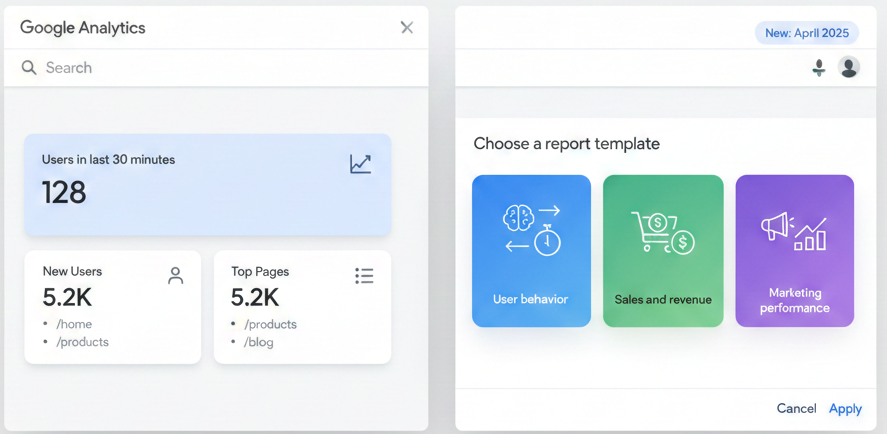
Standard reports provide “what” happened. Advanced reports (Explorations) provide “why” and “what if.” To bridge this gap, Google has recently doubled down on customization. In April 2025, Google released new template customization options for the Reports Snapshot .
This update allows property administrators to set a thematic overview based on business goals. While this is a step forward for executive dashboards, true analytical rigor still requires a deep dive into the Explore section .
2. The Engine Room: A Technical Taxonomy of GA4 Explorations
The Explore section is where raw, unsampled data (depending on volume) meets custom analysis. There are seven main techniques, each serving a distinct analytical purpose. Understanding which to use is the first mark of an advanced user.
| Exploration Type | Primary Use Case | Data Visualization | Complexity |
| Free-Form | Custom tables & charts (replaces UA Custom Reports) | Table, Bar, Line, Pie, Scatter, Geo Map | Low |
| Funnel | Step-by-step conversion drop-off analysis | Step-by-step funnel chart | Medium |
| Path | User flow & unexpected behavior discovery | Web of nodes (tree diagram) | Medium |
| Segment Overlap | Audience intersection analysis (e.g., Mobile x Converters) | Venn diagram | Low |
| User Explorer | Individual user journey analysis (granular debugging) | Timeline / Event list | Low |
| Cohort | User retention & behavior over time (e.g., Week 1 vs. Week 4) | Grid table with percentage bars | Medium |
| User Lifetime | Customer LTV analysis by acquisition channel | Table & Scatterplot | High |
Deep Dive: The Funnel Exploration
While the standard reports might show you a drop-off at a page, a Funnel Exploration allows you to diagnose why by breaking down the steps by dimensions like Device Category or City.
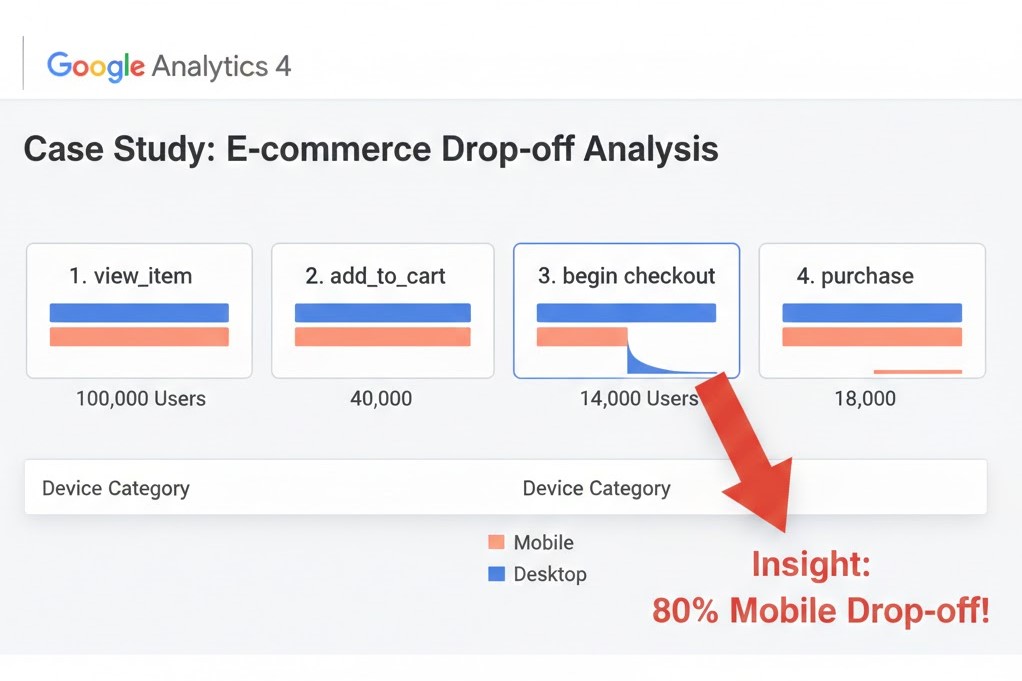
Case Study: E-commerce website Drop-off
Imagine you notice a 60% drop-off from Add to Cart to Purchase.
- Step 1: Create a Funnel Exploration with steps: view_item → add_to_cart → begin_checkout → purchase .
- Step 2: Break it down by Device Category.
- Insight: You might discover that mobile users drop off at begin_checkout at a rate of 80%, while desktop users drop off at only 30%. This indicates a potential checkout UI/UX issue on mobile.
3. Building the “Sales Performance” Report (A Step-by-Step Guide)
One of the biggest complaints from former UA users was the loss of the “Sales Performance” report (showing Transaction ID, Revenue, Tax, Shipping, Quantity). In GA4 reports, this must be built manually. Here is how to reconstruct it using a Free-Form exploration, incorporating advanced custom metrics .
The Goal: A table showing individual transactions with line-item details.
Methodology:
- Navigate: Go to Explore > Blank (Free-Form).
- Import Dimensions: Search for and import Transaction ID (or Transaction Item ID).
- Import Metrics: Import Purchase Revenue, Item Quantity, Tax, and Shipping.
- Critical Note: In GA4, Tax and Shipping are not always standard metrics. You must define them as Custom Metrics first.
- Go to Configure > Custom Definitions > Create Custom Metric.
- Set the scope to Event and define the parameter names exactly as they fire in your e-commerce events .
- Build the Report: Drag Transaction ID to Rows, and the metrics to Values.
- Refine: Apply a filter to only show Event name exactly matching purchase.
Result: You now have a granular, exportable sales ledger inside GA4, proving the platform’s capability to match UA’s depth when configured correctly.
4. SEO-Centric Advanced Reports: Analyzing Organic Search Behavior
For SEO professionals, Advanced GA4 reports are a treasure trove of behavioral data if you connect it correctly. The integration with Google Search Console (GSC) is mandatory. Once linked (via Admin > Product Links > Search Console Links), you can create reports that blend search queries with on-site engagement. This is a technique commonly recommended by any top-tier seo agency in egypt to move beyond basic rankings and understand real user behavior.
The “Landing Page Quality” Scorecard
Instead of just looking at “Impressions” and “Clicks” from GSC, combine them with GA4 engagement metrics.
Technique: Free-Form Exploration.
- Rows: Landing Page + Session Source/Medium (filtered to google / organic).
- Values: Sessions, Engaged Sessions, Average Engagement Time, Conversion Rate (for your defined goals).
- Insight: This report tells you which landing pages retain users and which have a high “bounce” (technically “not-engaged sessions”). A page ranking #1 with low engagement time needs a content refresh .
Tracking Event-Based SEO
GA4’s event model allows tracking of micro-conversions.
- Goal: Track how many users who land from organic search scroll to the bottom of a long-form guide.
- Method: Use the scroll event (automatically collected if Enhanced Measurement is on).
- Report: Create a Path Exploration with Session source / medium = google / organic as the starting point and scroll (with parameter value > 90%) as the ending point.
5. Leveraging Path Exploration for Content Strategy
Path Exploration is perhaps the most underutilized tool in the SEO arsenal. It allows you to see the exact sequences users take .
Use Case: Identifying Content Silos
You can set the starting point to your blog hub and remove the ending point constraints. The resulting web chart shows you the “next steps” users take. If 40% of users on a specific blog post go to a specific product page, that connection should be made more prominent via internal linking or a CTA.
This is exactly the type of insight an seo agency in egypt would use to propose a content restructuring plan.
6. Advanced Integration: Looker Studio and BigQuery
For enterprises, the GA4 interface has limits. Data sampling can occur in large-cardinality explorations. This is where BigQuery integration becomes non-negotiable .
The BigQuery Advantage
By exporting GA4 raw event data to BigQuery, you can run SQL queries across billions of unsampled events. You can join this data with CRM data or ad spend data to calculate true ROAS.
Looker Studio for Executive Dashboards
While GA4 explorations are analytical, they are not always presentation-friendly. Use Looker Studio to visualize the data you’ve structured.
- Templates: Use pre-built GA4 Looker Studio templates (like the Sales Performance template offered by Littledata) to save time .
- Blending: Blend GA4 data with Google Ads data for a holistic view.
7. Predictive Metrics and Machine Learning
One of the most “advanced” features of GA4 reports is its use of machine learning to fill the data gap left by privacy changes (like loss of cookie data). In the “Advertising” section, you can access models like:
- Purchase Probability: Identifies users likely to convert in the next 7 days.
- Churn Probability: Identifies users likely not to return.
Actionable Strategy:
Create a segment of “High Purchase Probability” users in the past 7 days who have not yet converted. Push this audience to Google Ads as a “Remarketing – High Value Prospects” list. This is the pinnacle of advanced reporting moving from descriptive analytics (what happened) to prescriptive analytics (what to do) .
8. Common GA4 Reporting Mistakes
- Relying only on default reports
- Ignoring engagement rate
- Not configuring events properly
- No BigQuery export
- Using last-click attribution logic mentally
9. The 2026 Reality Check: Limitations to Consider
No advanced guide is complete without a warning. As of 2026, be aware of:
- Data Sampling: In standard Explore reports, if your user segment exceeds certain thresholds, Google applies sampling to return results quickly. The only way to guarantee unsampled data is the 360 property or BigQuery export. For a digital marketing agency handling multiple clients, setting up these exports is crucial for accurate reporting.
- Cardinality: If you try to combine high-cardinality dimensions (e.g., User ID with Page Location), reports may be throttled or fail to load.
- Lack of Qualitative Data: GA4 tells you where users drop off (quantitative), but not why. Tools like Contentsquare or Hotjar (session recordings, heatmaps) are required to fill this gap .
Conclusion: The Future is Custom
Mastering advanced GA4 reports is no longer a “nice to have” for digital marketers; it is a core competency. By moving beyond the default Reports Snapshot and investing time in Funnel Explorations, Path Analyses, and integrations with BigQuery, you turn raw data into a strategic asset.
Start by identifying the one question your current dashboard can’t answer. Then, open the Explore tab and build the report that will answer it.
If you’re looking for a digital marketing agency to support your marketing efforts, don’t hesitate to reach out and see how we can help.